Executive Dashboard |
  

|
Navigation: Dashboard >
Executive Dashboard |
|
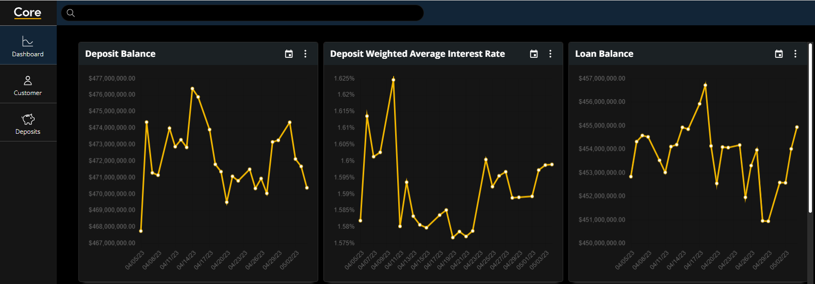
The Executive Dashboard screen in CoreView GOLD displays a variety of prebuilt graphs that provide overview information to help manage your business. Samples of the graphs include Daily Accounts Opened and Closed, Net Income Year-To-Date, Negative Account Balances, and more. The graph layout and order on the Executive Dashboard is customizable, and you can hover over charts to view detailed information about specific data points.
Using the Executive Dashboard Screen

Executive Dashboard Screen
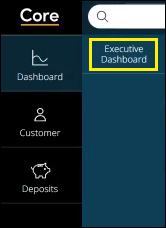
After logging on to CoreView GOLD, access the Executive Dashboard screen by clicking Dashboard > Executive Dashboard in the menu at the top-left of the screen.
Upon entering the screen, the following prebuilt graphs are available to view:
| • | Deposit Weighted Average Interest Rate |
| • | Loan Delinquency |
| • | Loan Balance |
| • | Net Income Year-To-Date |
| • | Daily Accounts Closed |
| • | Government Bank Balances |
| • | Daily Accounts Opened |
| • | Negative Balance Accounts |
| • | Deposit Balance |
| • | Total Vault Cash |
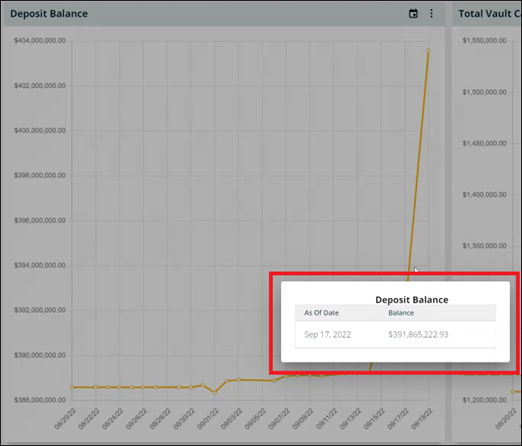
Hover your mouse over a chart to see detailed information for a specific data point, as shown below. This is especially useful for charts displaying daily opened and closed account information. The Government Bank Balances chart contains multiple balances in one chart, and you can hover over any of them to see the details. The Government Bank Balances tile also allows for the ability to select the labels at the top to temporarily remove them from the graph.
Depending on the chart, one or more of the following buttons are available in the top-right:
![]()
| • | Clicking the calendar icon |
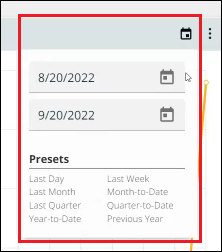 |
| • | Clicking the filter icon |
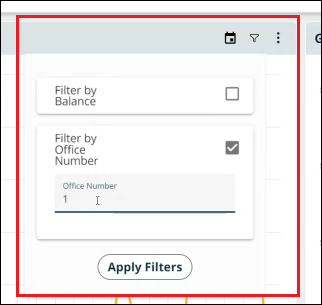 |
| • | Clicking the three-dot menu |
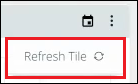 |
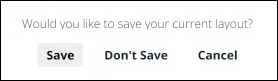
Each user can customize and save, if desired, the layout of their screen and graph sizes. A graph can be moved by left clicking, dragging, and dropping in a new location. The size of a chart may be enlarged by left-clicking and dragging the edge of the chart. When you leave or close the screen, the system will display the save dialog shown below.
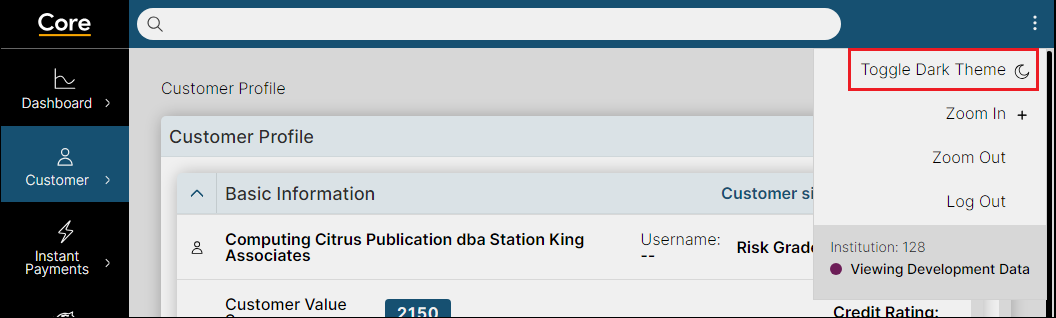
The Executive Dashboard may be viewed in “Dark Mode” by clicking on the three-dot menu on the top-right of CoreView GOLD screen and selecting "Toggle Dark Theme."