Navigation: VitalView GOLD >
VitalView dashboards are used to view aggregates—totals, weighted rates, averages, counts, etc. Millions of these aggregate values are calculated and stored in the SQL database every night. Dashboards are constructed with a variety of tiles. Some tiles, such as pie charts and bar charts, are used to display aggregates for a single day. Other tiles, such as line charts and sparklines, are used to display trends occurring over a period of time.
VitalView dashboards are accessed through Report Warehouse > Reporting Database > VitalView Dashboard in CIM GOLD. Multiple dashboards can be created, saved, and recalled.
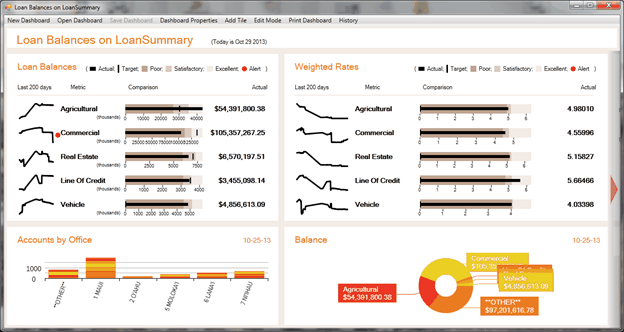
Below is an example of a VitalView dashboard.

VitalView Dashboard Screen
When you open the VitalView Dashboard screen, your home dashboard will automatically be displayed. If you do not yet have a home dashboard, a screen similar to the following will be displayed.

VitalView Dashboard Screen
Explanations for the menu items can be found at the following links:
|
Next topic: Initial View |
|
Previous topic: Summary Table Security Tab |